
Universal suffrage is a democratic right that we must all respect and uphold. Therefore, I would like to take this opportunity to thank all Sri Lankan voters who exercised their voting right in this election.
President Gotabaya Rajapaksa at the inaugural session of 9th parliament of Sri Lanka.
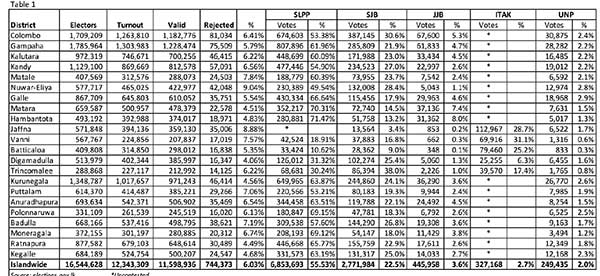
Now that the euphoria over the victories and the postmortems of the defeats have faded away it may be beneficial to take a look at a ballot number that has drawn less, if not no, attention: the Rejected Votes. What has drawn my immediate attention to the results of the last election was the large number of the ballots that were rejected – 744,373 to be precise. And that translates to more than six percentage points (6.03%) of the votes cast (see Table 1). Given that the Jathika Jana Balavegaya (JJB) and Ilankai Tamil Arasu Kadchi (ITAK) combined received just about the number of rejected votes (773,126) but collectively won 11 seats and secured two National List seats, the number of rejected votes should not let go unnoticed.
 An election provides a snapshot of peoples’ alliance with the political parties at a particular time in history and, for better or worse, the distribution of votes illustrates the intensity of such an alliance and consequences. For example, we know that about quarter of million people aligned with the UNP even though they did not secure a single seat in the parliament. Similarly, when a political party such as JVP with its 50 plus year existence, received less than half a million votes with the help of some progressive groups, there is message in those numbers. And we expect the voter turnout to truly reflect the voters’ intentions. Rejected votes, also known as spoilt votes, muddy such an assessment especially when the rejected votes amount to the third largest vote getter.
Why do we have such a large number of rejected votes? Rejected votes fall into two broad categories. One, a voter who is tired of the whole electoral process or each and every party in the fray, or the candidates running, may express his frustration by ruining the ballot by a means of his choice say, for example, by crossing all the parties. We call those protest votes. Then you get the voter who believe in the system and have a clear intention to vote for a party or a candidate of his choice but fail in the process of actual voting at the polling booth. He or she may cross more boxes than required, may draw the cross that goes over the margins thereby “spoiling” the vote and the authorities would refuse to count it as a valid vote.
My initial reaction to the large number of rejected votes was that it was the former i.e., there may have been a substantial number of people, hundreds of thousands of them, lost faith in the electoral process and cast a protest vote. However, as I looked at the election results closer, the numbers did not fully support my own theory. As the district-wise breakdown of voting pattern shows (see Table 1) there is a wide disparity in the rejected votes by the districts. They range from around 4% (Digamadulla) to as high as 9% (Nuwara- Eliya). If the rejected votes were a result of protest movement it is unlikely to have such a variation as it should take some form of normal distribution across the districts. And to the best of my knowledge there wasn’t any organized campaign for a protest vote during the campaign. If so, what explains this phenomenon? The history of elections held over the past 70 plus years appear to provide some answers.
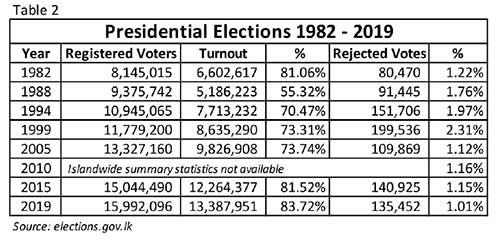
If you look at the presidential elections a totally different picture of the rejected votes emerges. Of the eight presidential elections held between 1982 and 2019 the percentage or rejected votes hover around just 1% (see Table 2). In the last presidential election held just a few months ago, the rejected vote was exactly one percent (1.01%) or 135,452 votes.
 The 15 parliamentary general elections held between 1947 and 2015 also shed some light on to the rejected vote phenomenon. As seen in Table 3, there is a clear distinction between the general elections held before 1989 (under single member plurality voting system) and the elections held since 1989 (under proportional representation system) in terms of rejected votes. The percentage of rejected votes started at 2.6% at the 1947 election and precipitously came down to a sheer one-half percent during the elections of 1970 and 1977. It jumped to over six percent (6.13%) at the first election under the proportional representation system and stayed around five to six percent ever since. While I haven’t provided statistical evidence here, Provincial Council elections also shows similarly large percentage of rejected votes.
So the evidence suggests that it is the type of the ballot that generated the large amount of rejected votes. When the voters were presented with a simple task of voting for a candidate from a list of contestants, over 99 percent of the voters didn’t have a problem of doing so. But when they were presented with a more complex ballot with voting for a party followed by the option of voting for three more choices things seem to get complicated and a large number of votes got rejected. I don’t think I need to mention how challenging the ballot paper under proportional representation system is.
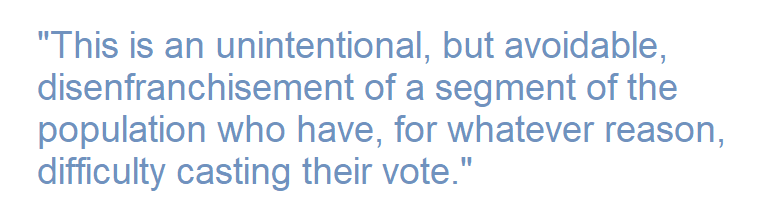
This is an unintentional, but avoidable, disenfranchisement of a segment of the population who have, for whatever reason, difficulty casting their vote. At the inaugural session of the Parliament the President thanked the voters who exercised their voting right at the election. Unfortunately, the government miserably failed to honour hundreds of thousands of those who exercised their constitutional right. What is clear is that the design of the ballot is flawed. It appears to disenfranchise the less sophisticated voter. What is not clear is how this flawed system might have affected the outcome of the election. For the latter further research is needed with honest collaboration of those who are responsible for holding elections.
I am baffled by the fact that the political parties have not made an issue of this large number of votes being rejected and call for the simplification of the voting process. This is not, and should not be, a partisan issue. The losers are not the ones who got elected or not elected but the public. Their votes got thrown out while they intended to vote. Politically speaking the most one has to lose in a participatory democracy is the vote and in the last election nearly three quarters of a million lost it and it seems like a pattern and not an aberration.
Indrawansa de Silva, Ph.D., Professor Emeritus, USA.